You must log in or # to comment.
Why is the x-axis, showing time, so weird? It starts off with one and two, then 3, 6, 9 and 12, but the spacing between them seems almost random.
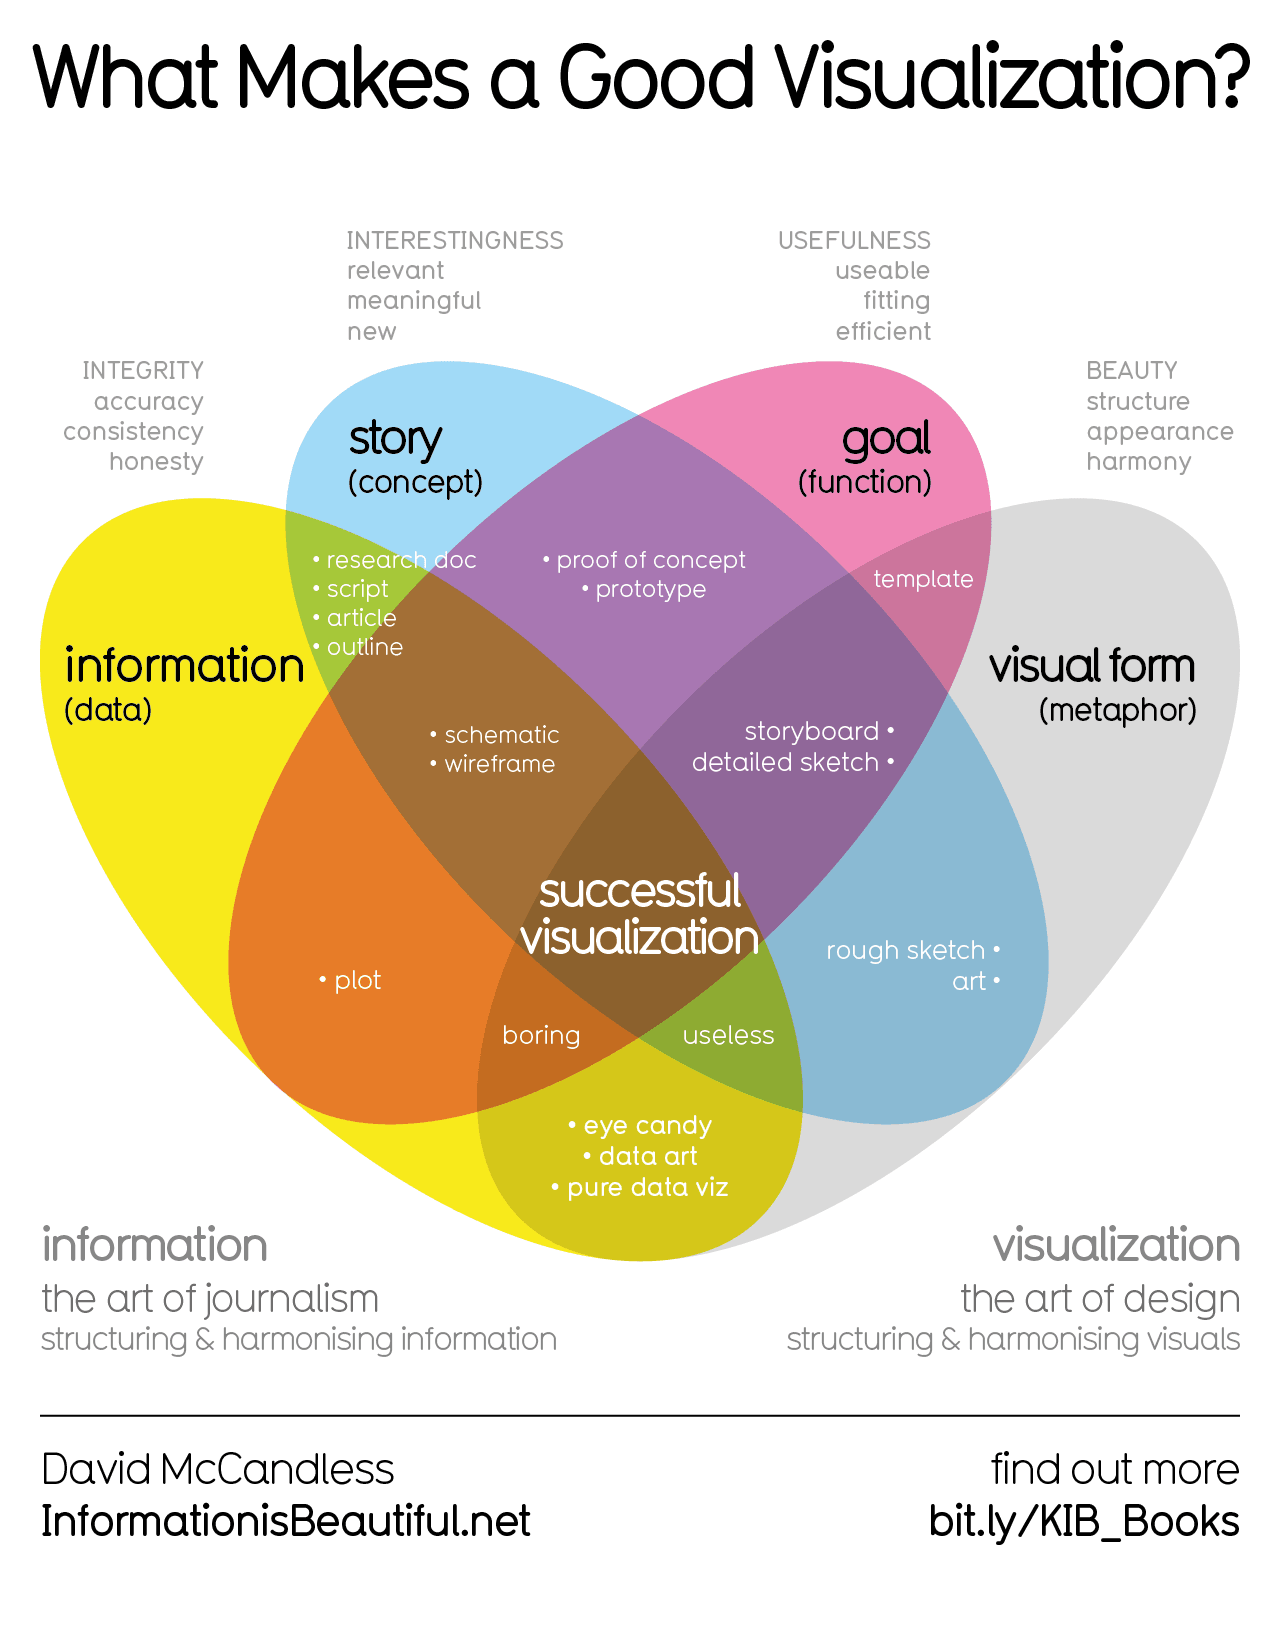
seems like the chart might have been labeled as creatively as this one:
spoiler

deleted by creator
Huh, so the President can affect gas prices. Just takes some extreme actions to do so.
Is this from today, him anouncing blockading the Strait of Hormuz?
